Cape Analytics: Impact 25 2018 profile
March 9, 2018
This is a summary of the profile which first appeared in the Oxbow Partners InsurTech Impact 25: 2018.
Cape Analytics offers a database of accurate, up-to-date property information that can be queried by (re)insurers via an API or in batch.
Data can be used for multiple purposes:
- Primary insurance: Validation of property features at point of quotation, improving quote speed and accuracy
- Reinsurance: Portfolio selection and analysis, where Cape Analytics data is input to reinsurers existing CAT models to assess and monitor cedent’s portfolios (e.g. number of gable roofs) and to test the quality of the underlying data being used by cedents
“Cape Analytics’ solution provides us with instant access to validated property features at the time of quote. Their data and technology have been extremely valuable to our business and improving customer experience.”
Werner Kruck,coo, Security First Insurance
Impact
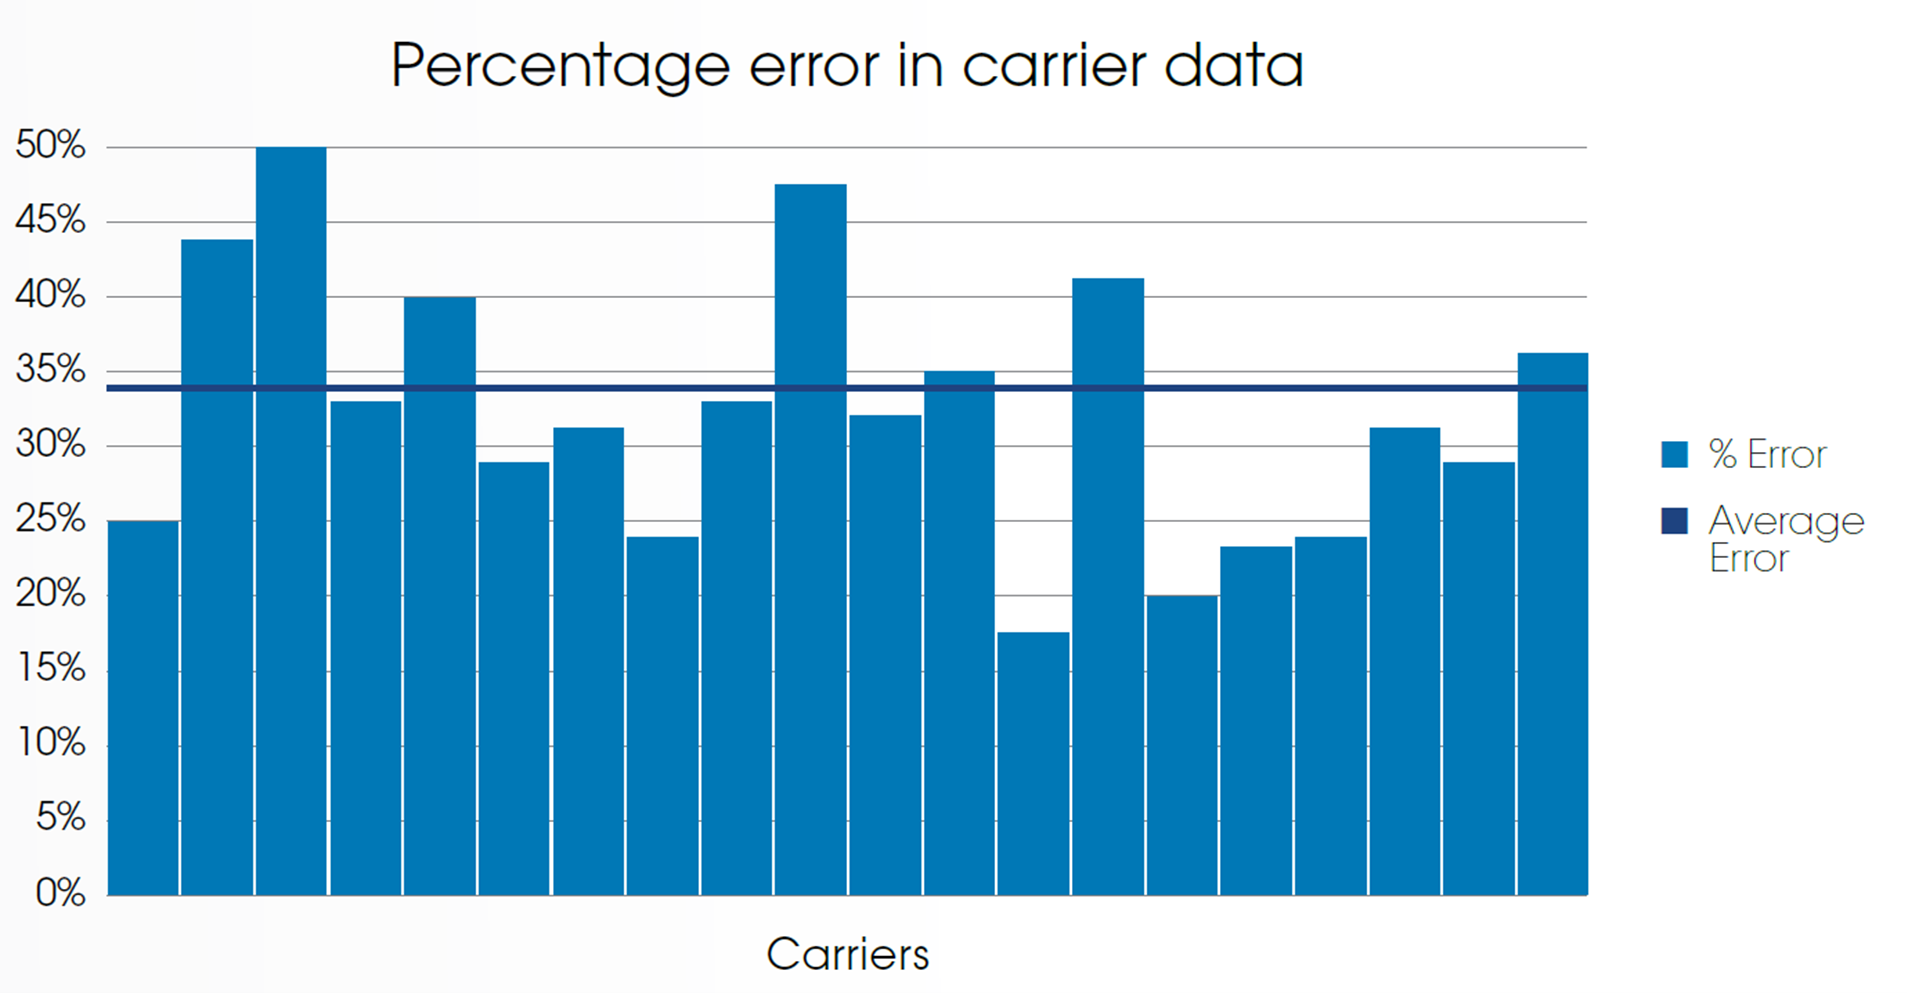
Cape Analytics has reviewed cross sections of over 50 US insurance carriers’ books of business. On average Cape Analytics finds that over 30% of a carrier’s policies are bound with incorrect data.

Case Study One
Client situation: A leading US regional carrier was in the process of evaluating their traditional inspection programme in order to improve efficiency, reduce costs and improve customer experience.
What they did: Cape Analytics provided data allowing the carrier to move to a virtual inspection platform. The insurer also updated their underwriting workflow to automatically triage properties based on roof geometry and roof condition in order to understand which properties were most likely to result in an actionable inspection discovery.
Impact: The insurer reduced inspection spend by over 50% and eliminated customer involvement in scheduling and participating in physical inspections, whilst maintaining underwriting quality.
Case Study Two
Client situation: XL Catlin’s reinsurance business wanted to empower their cedents with better data for decision making to help with more accurate reinsurance purchasing and pricing.
What they did: Cape Analytics evaluated the difference in Average Annual Loss for cedent portfolios before and after using Cape Analytics data.
Impact: Using Cape Analytics data resulted in up to +/- 15% change in Average Annual Loss for cedent portfolios. XL Catlin was also able to understand the accuracy and completeness of data in cedent portfolios.
The Oxbow Partners View
Traction: Cape Analytics is establishing itself as one of the leading emerging geospatial analytics providers. It recently agreed a partnership with Tiger Risk, the broker, and Nephila, the alternative capital provider is a client. In October 2016 the business raised $14m; XL Innovate, XL Catlin’s venture arm, is an investor.
Potential: Risk surveying (at point of underwriting and claim) are high cost activities that are ripe for technological enhancement. We see Cape Analytics’ proposition as one of a suite of technologies which will help insurers and brokers take cost out in this area. Furthermore, peak capacity management has come into sharp focus with the recent storms in Florida; this is a capability Cape Analytics can help deliver.
The 2018 challenge: The geospatial imagery and analytics space is quickly becoming crowded. It remains to be seen whether the market becomes an oligopoly (similar to catastrophe modelling) or if there will be a range of niche suppliers. Cape Analytics will need to broaden its footprint quickly to be positioned for either scenario.