Data & Analytics benchmark in Corporate & Specialty
18 July, 2020
Oxbow Partners recently completed the second edition of its Data and Analytics (D&A) benchmark study in pricing and underwriting for Corporate and Specialty insurers. Advanced D&A is becoming increasingly important in this market, as we have seen in the latest Lloyd’s Lab cohort focused on COVID-19 that kicked off this week featuring D&A firms Praedicat and Metabiota. In this post we provide three strategic observations from the benchmark research. If you would like more information about participating in the benchmark, please contact the team here.
Commitment to D&A is now driven from the top
When we first ran the benchmark in 2017, we found that leadership commitment to D&A was sporadic between the participants. Typically, this meant a one to two D&A champions on executive teams and boards. Only the market leading firms had achieved full board commitment and dedicated investment into D&A.
In 2020 we have found that firms without full board buy-in to D&A were in a small minority as data has worked its way up the strategic agenda of boards across the market.
Get market insights straight to your inbox
Market leaders adopt a hybrid D&A operating model
Perhaps more than other insurance markets, the niche nature of risks covered in Corporate & Specialty requires the experience and specialist knowledge of individual underwriters to a higher degree than in other lines that are driven by higher volumes of data. The skills of a London Market underwriter also extend beyond their ability to price risks but also to form relationships with brokers.
The introduction of new tools has therefore led to a clash between traditional, human-led approaches, and more data-driven approaches. Benchmark participants reported that increasing D&A tool adoption and utilisation was one of the major challenges to achieving greater D&A maturity.
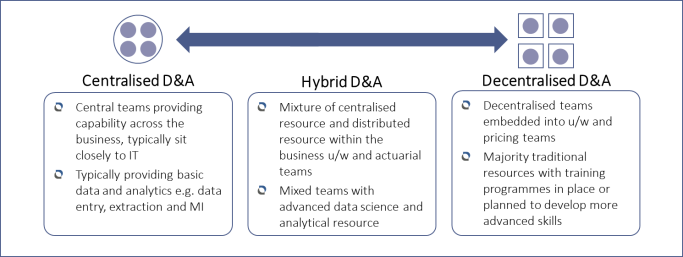
We found that insurers broadly adopt three D&A operating models. At one extreme, all D&A resources are held centrally and at the other end of the spectrum, D&A resources are fully decentralised and sit within the business units. The third model is a hybrid model that combines both central and embedded D&A resources.
In our results we found that the hybrid model was preferred by the market leaders due to the closeness between D&A resources and business teams which provide the benefit of greater collaboration and buy-in to D&A initiatives. For more on D&A operating models, please see our previous blog post.
Relative decline in the hype over third party data sources
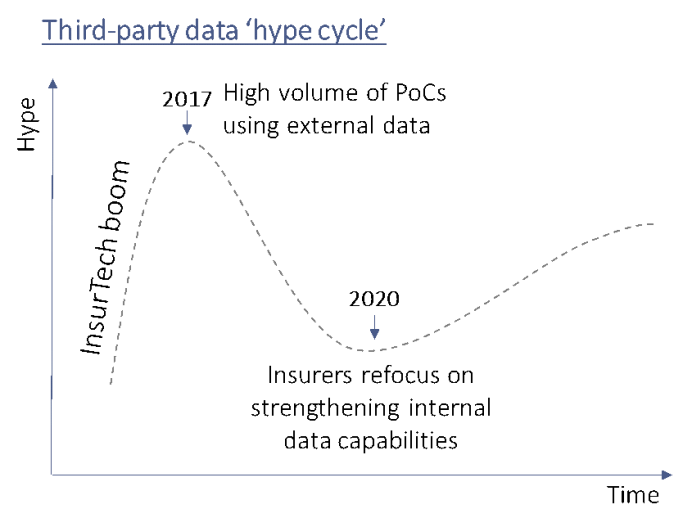
Finally, in 2017 insurers were experimenting with the use of novel third party data sources in their pricing and risk models. There are now many examples of successful (and well-funded) supplier InsurTech that specialise in this area, such as Impact-25 members Concirrus and CyberCube.
However, in 2020 our benchmark has shown a change in emphasis on the balance between external and internal data. It appears that hype has declined, and insurers appear to be strengthening the foundations of their capabilities using internal data. A common response from interviewees was “there is still more much more value we can get from internal data”.
Whilst there is still value seen in the use of external data the optimism about there being a ‘silver bullet’ has declined. We believe that this is driven largely by the heterogeneous nature of product lines in corporate and speciality. Unlike general insurance which has a few large volume product lines (e.g. home and motor) corporate and speciality is much more disparate. This means one external data source may only be relevant for a very small proportion of business. Hence, skewing the cost to value ratio. This has led to insurers rebalancing focus back towards internal data sources in the near term.
Benchmark Methodology
The D&A benchmark data is gathered via interviews with senior D&A representatives, typically CDOs, CUOs and Heads of Pricing. The interviews seven areas (e.g. Strategy, People, Techniques) that enables us to understand each firm’s D&A capabilities. The responses are assessed against our five-point scoring framework.
This framework provides participants with a comparison of their results against the benchmark average and a segmentation of results between the market leaders and laggards.


